 Maximilian Filtenborg

An introduction to structured logging and its advantages using the structlog package for Python.
Logs can be of incredible value when you are confronted with an error somewhere
in your system. Especially when you are trying to locate and resolve a critical
bug! Given that there is a log that describes the error, it is nice when it
contains a succinct message, and some context in the form of values of
variables, tracebacks of exceptions, etcetera. In other words: logs should
enable you to quickly find the information you need. In this post, we will take
a look at how structured logging can help to accomplish this, along with
structlog, a Python package for logging.
So, what is structured logging exactly? Put simply, it is formatting your logs such that they are not only easy to parse by humans, but also computers. This allows us to extract information from the logs more easily, without using complex regular expressions that are impossible to understand, or maintain. Some areas where this can be of benefit are: readability, searchability, and consistency. Logs as data, not mere text.
How do we make logs structured? By using a certain data structure and
serializing them to a specific format. Using JSON is commonly considered best
practice, and we will be using it as well. For the data structure, structlog
will help us out.
structlogTo get started, we need to install
structlog in our environment:
|
|
Next, we start a Python interpreter and import it, after which we can log a message, including some context:
|
|
As can be seen, it is quite straightforward to use structlog instead of the
logging module from the standard library. Just import structlog instead of
logging and replace logger = logging.getLogger() with logger = structlog.getLogger().
Noteworthy is that the keyword arguments work in the same manner as a regular dictionary. As a matter of fact, under the hood it is a regular dictionary. So, if you want to log any variables together with your message, simply pass them as keyword arguments, and they will appear in the output as shown above.
Note: if you prefer to not install third-party dependencies, there is a recipe in the Python logging cookbook to implement structured logging using only the standard library.
What we have talked about thus far is not structured logging, and before we get
around to it, we must briefly discuss the notion of structlog
processors.
A log processor is a regular callable, i.e. a function or an instance of a class with a call() method.
Log processors can be composed into a processor chain, and add, for instance, a timestamp, the log level, or in our case a JSON renderer:
|
|
There are lots of available processors, and lots of configuration options. Check the documentation to see what is possible.
Now that we have properly configured structlog for JSON formatted logs, we
see that running the above log statement again gives the desired result:
|
|
By also using structlog.processors.dict_tracebacks, we make sure exceptions
also display using JSON:
|
|
Beware that only log statements from the application itself will use JSON, not
those from dependencies. To output logs from installed packages using JSON as
well, you can take a look at
python-json-logger, and
additionally read up on how to set it up with structlog
here.
While having JSON logs in your production setup is nice, you might prefer regular logs for development. For example, compare our development setup:
|
|
to our production setup, for which we use python-json-logger as well:
|
|
Another option is to use the same configuration for development as for production to reduce complexity; whichever way you think works best for your use case. The takeaway here is, that by changing the used processors in the processor chain, it is fairly easy to change the way logs are processed, and displayed.
To hook up python-json-logger with the logging code, we set the formatter in
a logging.conf file. This file can be used to configure logging on
application startup, ideally before any log is written. A minimal example:
|
|
You should configure the logging module before configuring structlog:
|
|
Thus, given all of the above, how does structured logging help us in a real world scenario? Let us take a look at an example.
One of our applications, which is a web app, writes its logs to stdout. It is containerized and resides in a Google Kubernetes Engine cluster. Without any further setup, these log statements are automatically picked up by Google Logs Explorer, as shown below:
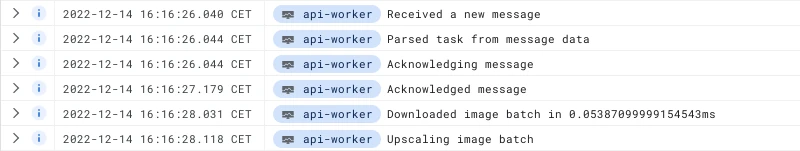
Each line contains only the log statement its message, which makes the log as a
whole fairly easy to read. Everything else we might have provided for context
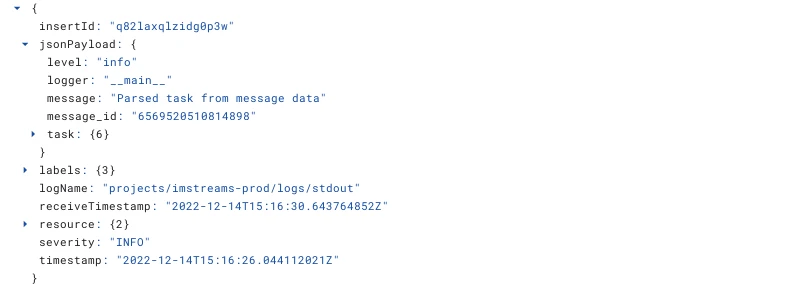
using structlog, is put into the jsonPayload field. When we want to see
more details from a specific log statement, we simply expand it:
Furthermore, if we are interested in all the log statements that contain a
specific field, let us say the message_id, we can click on its value in the
jsonPayload, and add it to the summary line:
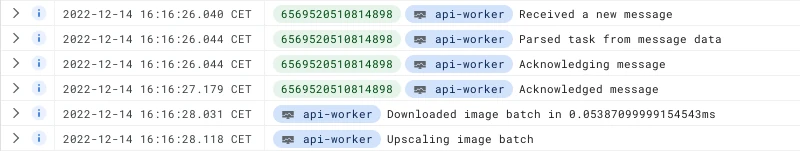
Now all the log statements that contain the same message_id stand out.
We have seen how structured logging can make your logs expressive and powerful. Specifically, how they become better readable, better searchable, and more consistent overall. Additionally, we saw this can be achieved with relatively minimal setup using a real-world scenario. If you are not using structured logging yet, you are missing out on a better development experience.

Maximilian is a machine learning enthusiast, experienced software engineer, and co-founder of BiteStreams. In his free-time he listens to electronic music and is into photography.
Read moreEnjoyed reading this post? Check out our other articles.
Maximilian Filtenborg
 Maximilian Filtenborg
 Maximilian Filtenborg