 Donny Peeters

Business Intelligence (BI) is about using data to drive better decision-making. However, BI dashboards need to be designed with certain aspects in mind to be genuinely effective. In this post, we'll explore some essential practices to help organizations maximize the value of their BI efforts.
Business Intelligence (BI) practices have become increasingly popular over the years. However, the success of a BI practice hinges on several critical factors, including a well-designed data model, effective dashboard UI/UX design, the delivery of insights, and a culture of data-driven decision-making. This blog post will explore these factors in-depth, discussing why they are essential to successful BI implementation. Additionally, we will touch on the potential benefits and pitfalls of self-serving analytics, which have become a trend in recent years. Our goal is to provide actionable insights to help organizations leverage BI effectively to drive better decision-making.
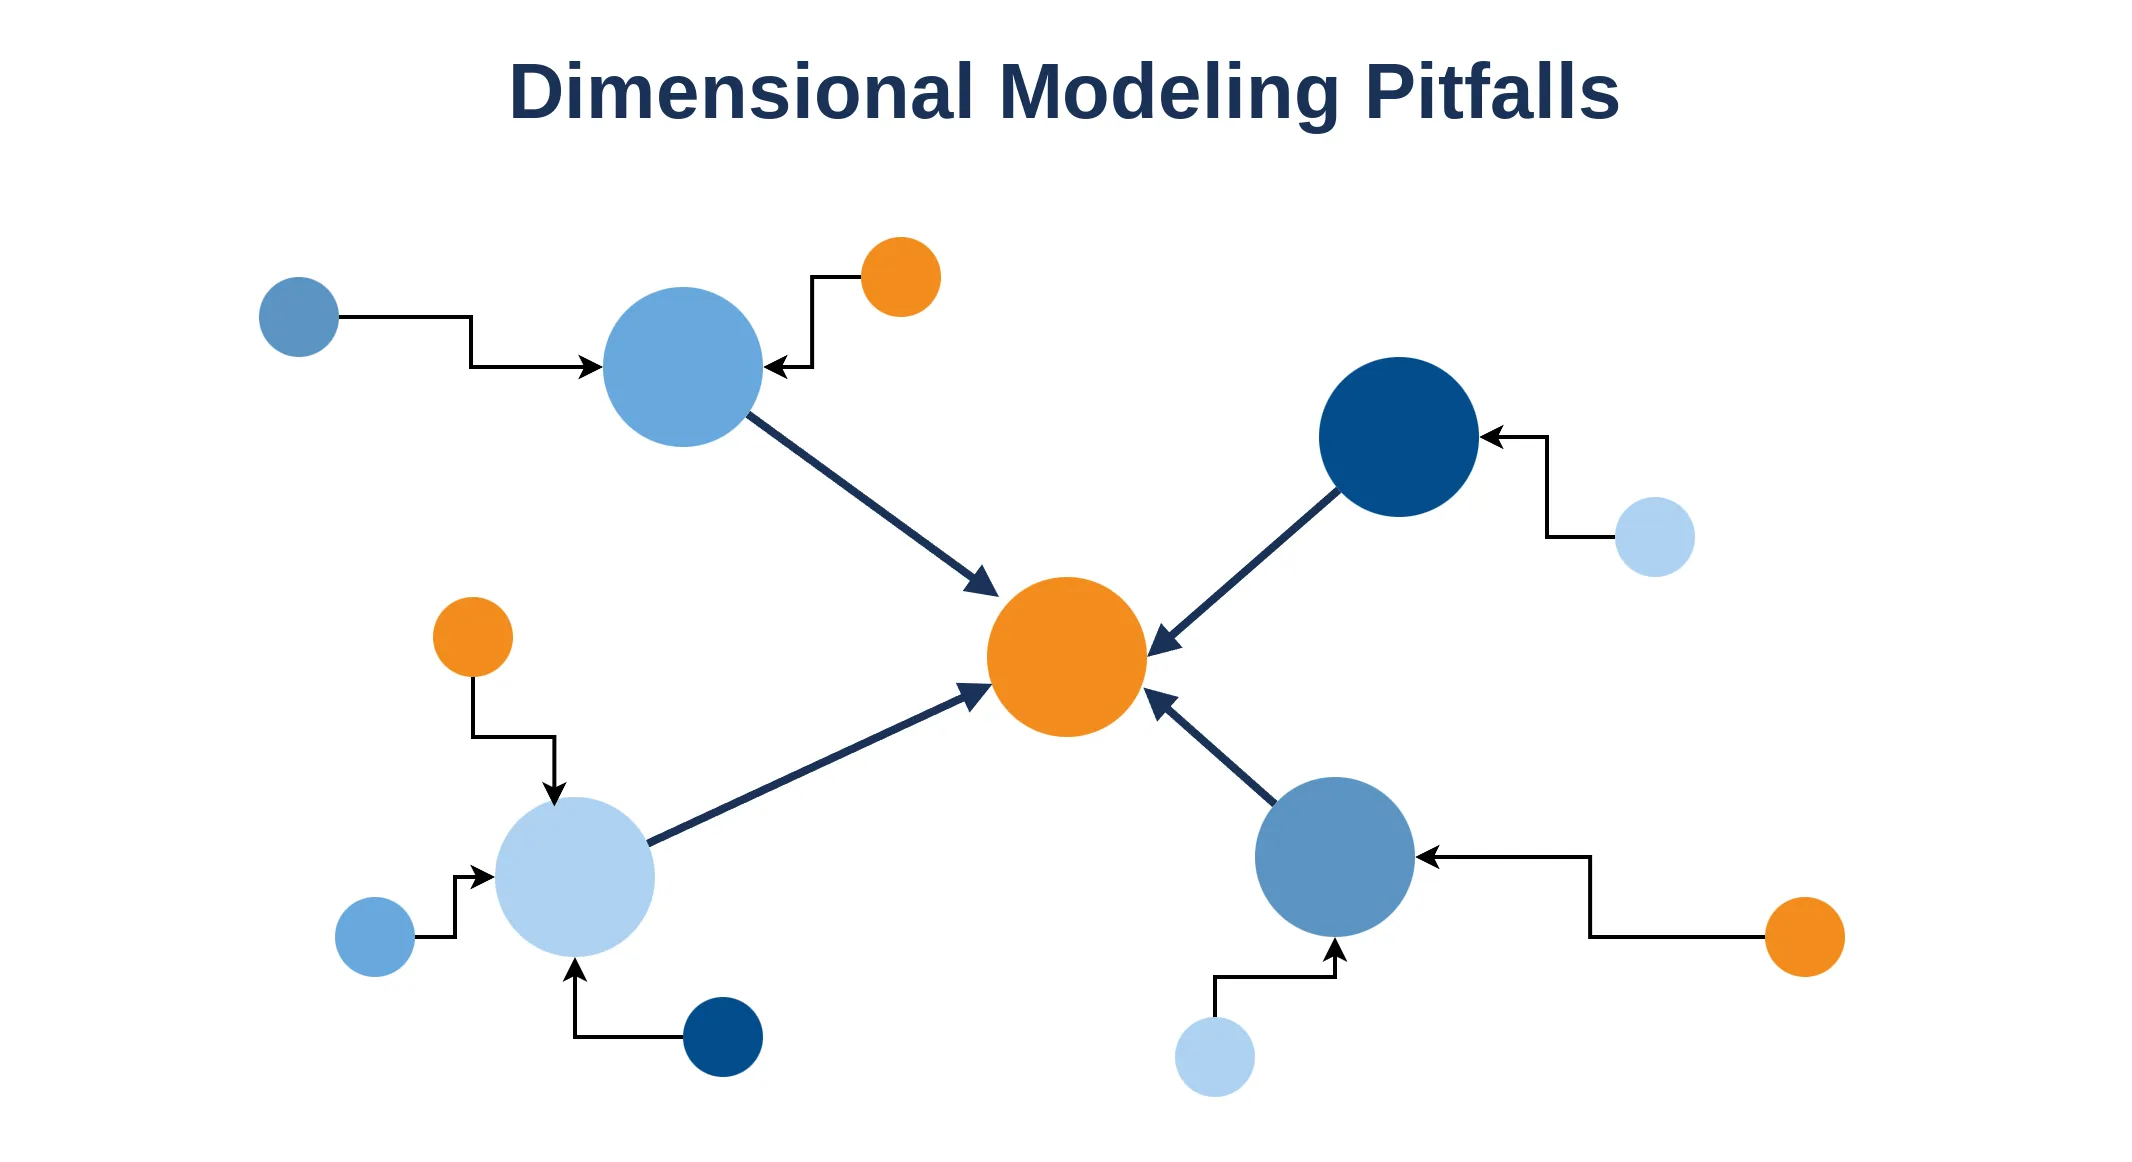
A robust data model is the backbone of any successful BI practice. While the star schema is a popular choice, choosing a schema that aligns with the organization’s specific use case is essential. A well-designed data model makes all the difference while setting up reports and dashboards.
A well-designed data model also ensures the dashboards perform well. The dashboard’s performance is crucial as it significantly impacts the user experience. For example, nothing is more dreadful than a dashboard that needs to load for 5 minutes every time you change a filter. Additionally, a good data model makes building your analytical reports much more straightforward. This phenomenon is quite intuitive because if the data model is complex, creating the graphs and reports you want is also complicated.
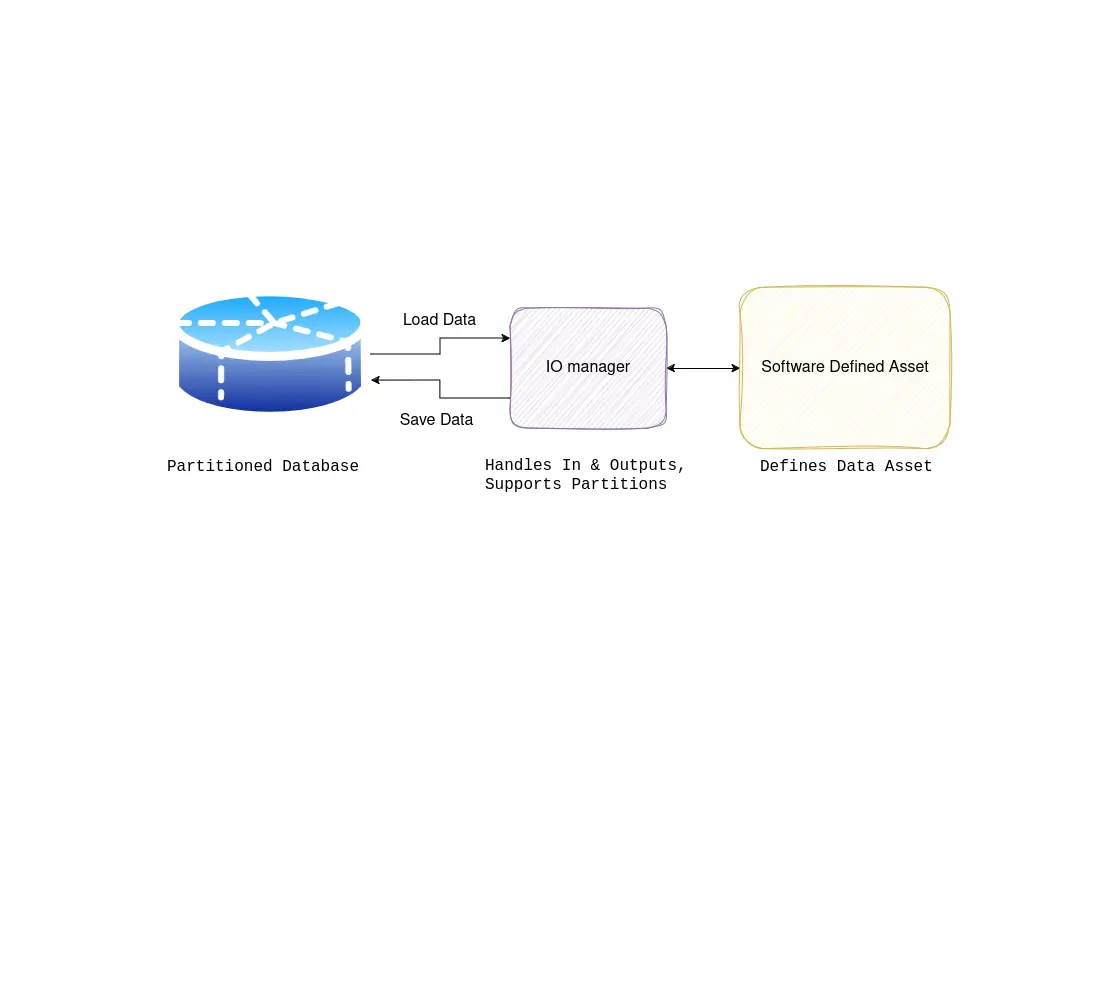
Another downside of a sub-optimal data model is that these modeling challenges must be solved in the BI layer. This is not necessarily an issue when looking at whether this is possible, Power BI, for example, has quite powerful transformation capabilities. However, this will result in all kinds of business logic being encoded inside the (BI) presentation layer. For people coming from software engineering, this will immediately start to ring alarm bells; having logic encoded inside a presentation layer is not a good idea. Ultimately, this will result in a messy BI practice; different reports will analyze the data in different ways, producing different results. The solution is to encode data transformation logic (business logic) within a version-controlled git repository, which is, for example, possible with dbt.
The success of a dashboard hinges on its usability. A good UI/UX design can distinguish between a widely-used dashboard and an ignored one. To create a pleasurable user experience it’s essential to consider the end user’s needs and focus on presenting information clearly and intuitively.
A well-designed UI/UX can significantly enhance the usability and effectiveness of a dashboard. Users should be able to quickly and easily find the information they need without navigating through cluttered or confusing screens. Additionally, the design should be visually appealing and easy on the eyes, as users are likelier to engage with an aesthetically pleasing dashboard. In addition, it is also essential to consider the needs and preferences of the dashboard’s audience. The design should be tailored to the user’s level of expertise, such as using charts and graphs for visual learners or tables for data-driven users.
Typical vital points to check are:
Choosing the proper information density is one of the most challenging aspects when designing a dashboard. While including every available data point on a dashboard can be tempting, doing so can be counterproductive. Overloading dashboards can make it difficult for end-users to identify the most important information or see the story the data is trying to tell. Instead, dashboards should be designed with a specific goal in mind and only include the most relevant information.
The greatest value of a picture is when it forces us to notice what we never expected to see.
— John Tukey
A key objective of any BI practice is to provide insights that drive better decision-making. To achieve this, dashboards should be designed to enable comparisons and highlight trends over time. When used effectively, dashboards can provide valuable insights that allow organizations to make data-driven decisions.
It is not uncommon for organizations to limit their use of dashboards to the first stage of BI, which involves reporting on past events. However, to gain a more comprehensive understanding of their data, organizations must move beyond this basic level of reporting and delve deeper into the reasons behind the trends they observe. This is where the actual value of BI lies - in generating meaningful insights that drive decision-making. To fully leverage the potential of BI, it is helpful to adopt a framework that includes the following stages:
Unfortunately, many BI reports stop at the first stage, failing to deliver the full range of insights that can be gleaned from data. This is like having cake without the whipped cream and cherry on top - it’s only a partial solution.
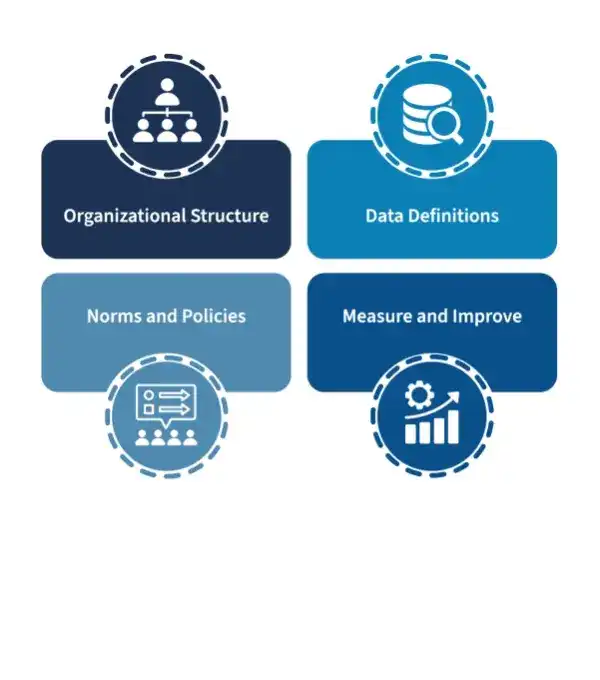
For BI practices to be truly effective, they must be integrated into the organization’s culture. This can be achieved by setting KPIs or targets and encouraging teams to review data and dashboards daily. When data-driven decision-making becomes part of an organization’s culture, BI can truly deliver value.
Fostering a data-driven culture is easier said than done, and a lot has been written on the topic: Forbes, McKinsey, another blog post.
In the video below we explain what it means to be data-driven, of which culture is an important part.
Self-serving analytics allows end-users to create their own reports and visualizations within a BI tool without relying on IT or data experts. However, while self-serving analytics can be beneficial for empowering end-users and increasing adoption rates, it can clash with the points made in this article about creating effective dashboards. Self-serving analytics has been a trend, but we have seen mixed results.
Firstly, a solid data model is crucial for effective BI, and end-users may need more expertise to create an appropriate model. This could lead to inaccurate or incomplete data being used in reports and dashboards, negatively impacting decision-making.
Secondly, prioritizing UI/UX design for dashboards becomes more challenging when end-users create their reports. However, given a consistent design approach, standardized data models, and business logic, the resulting information may be clear and easy to navigate.
Finally, a data-driven decision-making culture could be fostered using self-serving analytics. However, without proper training and education, end users may not know how to interpret data correctly, leading to incorrect conclusions and decisions.
While self-serving analytics has its benefits, it is essential to balance empowering end-users and maintaining a solid foundation for effective BI. Organizations should ensure proper training and education for end-users and have guidelines to ensure consistent data models and design principles across reports and dashboards.
To get the most out of BI, organizations need to build a strong foundation with a solid data model, prioritize UI/UX design for dashboards, avoid overloading dashboards with information, use dashboards to deliver insights and foster a culture of data-driven decision-making. By following these critical practices, organizations can unlock the full potential of their BI efforts.
Are you looking to grow your business using BI? At BiteStreams, we have experience in each critical factor, including designing a solid data model, prioritizing UI/UX design for dashboards, delivering insights, and fostering a culture of data-driven decision-making. Contact us today to see how we can help you leverage BI effectively to drive better decision-making.

Maximilian is a machine learning enthusiast, experienced software engineer, and co-founder of BiteStreams. In his free-time he listens to electronic music and is into photography.
Read moreEnjoyed reading this post? Check out our other articles.
Donny Peeters
 Maximilian Filtenborg
 Maximilian Filtenborg
Get more data-driven with BiteStreams, and leave the competition behind you.
Contact us