 Maximilian Filtenborg

How to create proper insights into a distributed job queue using streaming analytics.
“A distributed system is one in which the failure of a computer you didn’t even know existed can render your own computer unusable.” – Leslie Lamport
Managing a distributed system is hard. Two-phase commits, silent failures and phased deployment strategies are just a subset of challenges teams have to face. Unfortunately, scaling vertically has its limits, so many companies do inevitably end up with a distributed system.
A popular way to scale horizontally is to introduce a job queue and start application workers. This article discusses how one can add crucial insights into a job queue. In particular, we discuss how to monitor performance and keep track of causality for jobs using streaming analytics.
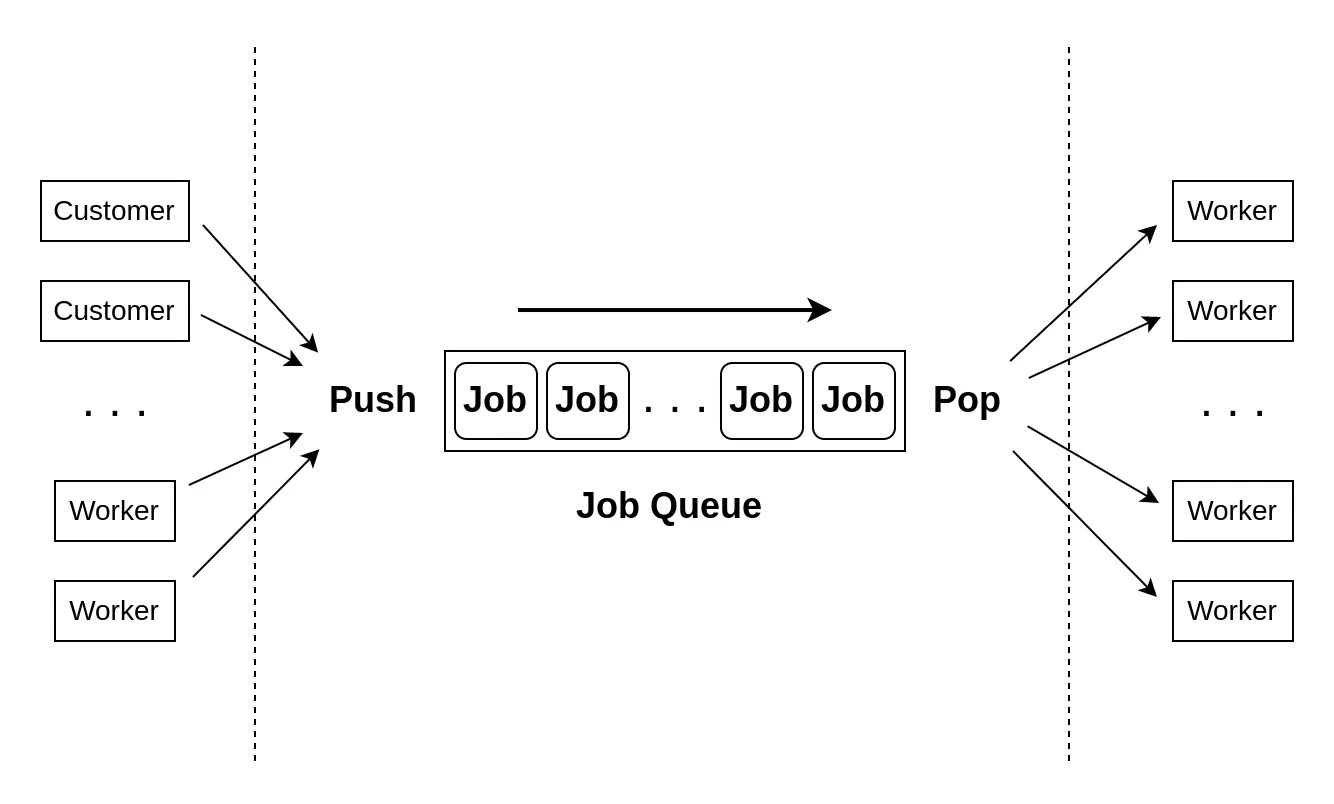 Figure 1: schematic of a job queue.
For the sake of this post, we assume that a distributed system is a set of instances (nodes) that do work and can communicate through messages. Such a system might serve web pages, provide API’s or process data. It can do all this in parallel as well. Examples of distributed systems are:
In recent years, a lot of cloud native tooling has become available to help companies set up their scalable software solution professionally. In terms of writing software, Kubernetes and Docker have made it really easy to deploy a distributed system in the cloud. In this day and age, not losing sight of communication flows in your system has become a big challenge.
A common approach to distribute the load of a system is to use the last approach: use a job queue. Popular backend application frameworks such as Laravel and Django make it easy to implement one. A job defines a unit of work that can be dispatched and handled by a worker. A worker could be an application process on a different machine, but also your favorite cloud native tooling (think AWS Lambda and Google’s Cloud Functions). You can use jobs to asynchronously send emails to users, update metrics or transform a batch of data.
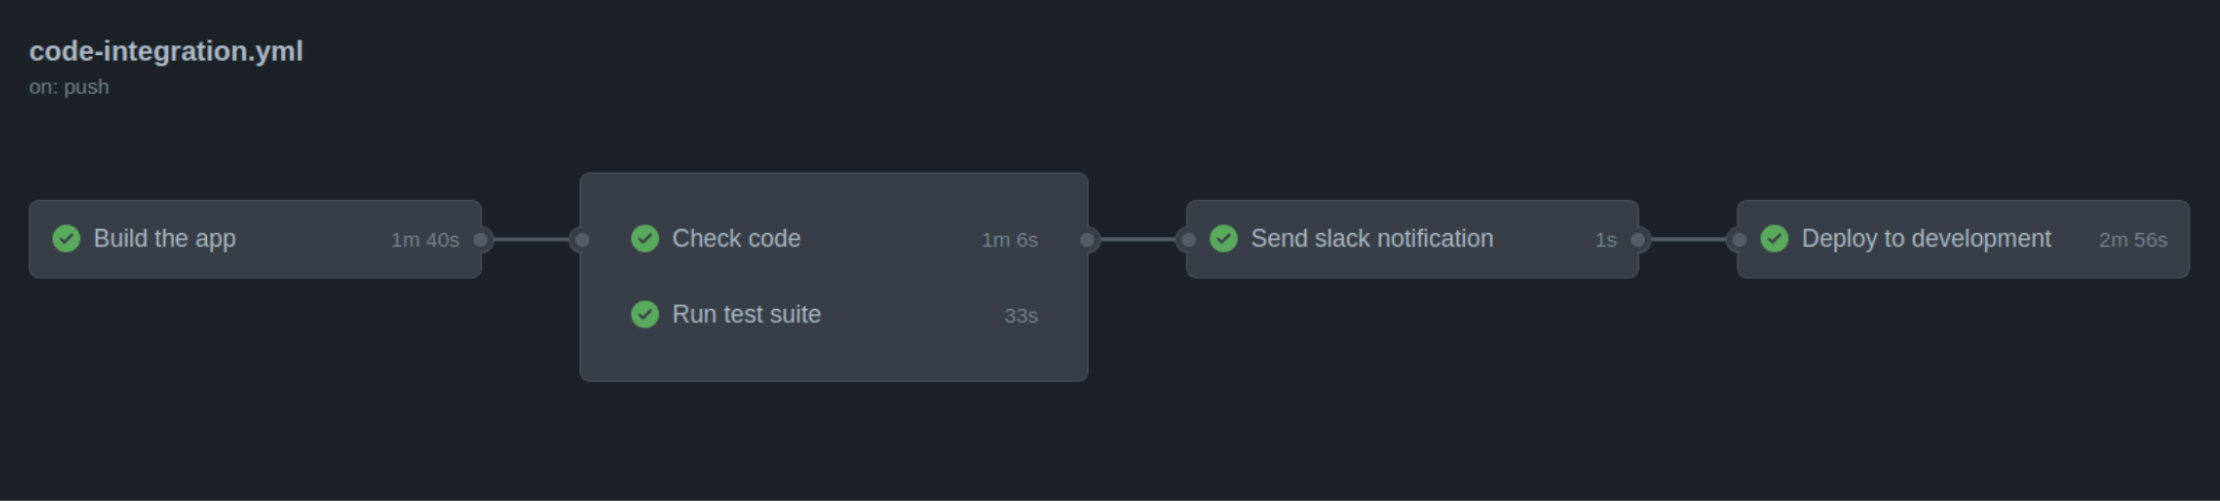 Figure 2: a Github Action workflow.
Workers can often dispatch new jobs while running another job. This creates a chain of jobs performing a workflow. A well-known example of this are the workflows defined in a Github Action, see Figure 2.
Finishing the ”Build the app”-job triggers both the “Check code”-job and the “Run test suite”-job, etc. Another popular tool that uses workflows is Apache Airflow, see Figure 3.
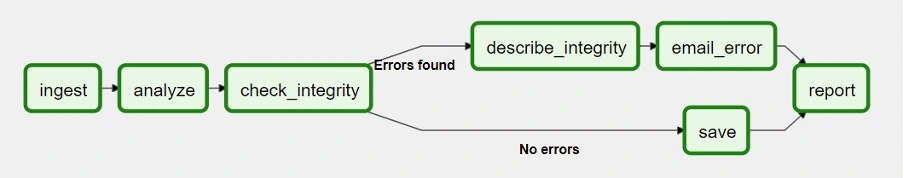 Figure 3: Apache Airflow DAG example. [Source]
Apache Airflow helps you build data pipelines using what they call DAG’s, which stands for directed acyclic graph.
Simply put, a directed acyclic graph is a set of nodes and arrows connecting the nodes, that has no cycle, i.e. the workflow does not contain a recursive loop making it run infinitely.
As an example: when you add an order to a booking system, you expect it to send a confirmation email, create an invoice, transfer the order to a shipping service, and perhaps update some analytics on the system.
Now that we know the fundamentals of a job queue, what are the most important metrics to keep track of? There are two main categories and each answers their own set of questions. the first one is what we cal Job statistics, which focuses on metrics of one job, such as:
The other one is Job causality, also known as tracing, which focuses on metrics and insights into workflows:
Such insights would allow organizations to monitor their system on a granular level and optimize workflows across their business. In the order example, you also want to know which order triggered the creation of which invoice, but be able to create invoices manually at times as well. Moreover, once customers start complaining about orders not arriving, you are often too late. Ideally, you want to spot clogs in the pipeline as soon as they occur.
In addition to such a live view, you want to see each job’s impact on overall performance and trace jobs back to the original job that dispatched them. And you want to see it in real-time.
A lot of tooling around message streaming and data workflows (such as Apache Airflow) provide insights out of the box. However, many job queues are not designed for a high volume stream of messages to provide real-time analytics and workflow analysis.
How do you add these insights to the system? We can deduce a reasonable set of requirements for such a solution:
This is often how you want your analytics to work: with minimal impact on crucial systems.
One technique that fits into these requirements is event streaming. Storing events is a popular way to create granular insight into a system since it shows you the changes in your application, not only the current state (as a relational database often depicts). Storage is cheap these days, and computers are fast. Hence, storing and querying all relevant changes to a system is feasible. This also enables you to create real-time insights: every event can be processed immediately to trigger new jobs, update a view or update a statistic.
For the insights into job queues, it is also possible to use event streaming. You can keep track of counters, relations and aggregates of jobs that update with every event coming in. This technique is better known as streaming analytics. Streaming analytics requires you to rethink what it means to do analytics, since you do not have all data available at once.
But how to implement such streaming analytics in our use-case?
To keep track of both job statistics and causality,
we need to keep track of several events that happen in a system with a job queue.
Three important steps in the life cycle of a queued job are: when it is dispatched, when it starts and when it ends.
From these we can easily distill the queueing time (start_time - dispatch_time) and runtime (end_time - start_time).
Hence, throwing events at these stages in the system allows us to keep track of all of the job statistics we defined earlier.
However, this does not solve the issue of tracking the causality between jobs.
For that issue, we need to add three id’s per job to the data stream:
job_id: unique identifier for a jobparent_id: the job_id for the parent job that dispatched the current jobtrace_id: identifier shared among jobs connected through parent-child relationsThe last two identifiers allow us to gather all jobs that were triggered from a single source. We could group by all jobs that were triggered through a client placing an order, for example.
Note: Jobs are often defined as either a class implementing some interface or a function in the code. But there usually is some unique name associated with every job that can be run. This could for example be “SendEmail”, where each “SendEmail” job has an email address and body as parameters. We call “SendEmail” the job type. A job type defines a piece of code you can monitor and optimize if needed, so it naturally defines the language of the insights.
Once this data is determined, it is time to connect to a database that supports event streams, such as Apache Kafka or RabbitMQ. An example log that includes the required data would have the following fields:
|
|
A job that triggers a pipeline of other jobs is collected into a trace.
All jobs in a trace (one run of a workflow) have the same trace_id.
The parent_job_id points to the job that dispatched the current job.
Of course, producing the data is not enough. We have to consume and transform the data to make it available for users. (In a later blog post, we go into more detail about writing a dispatcher and consumer for these kinds of events, including simple ways to store such data.)
A simplistic overview of the added system would be as follows:
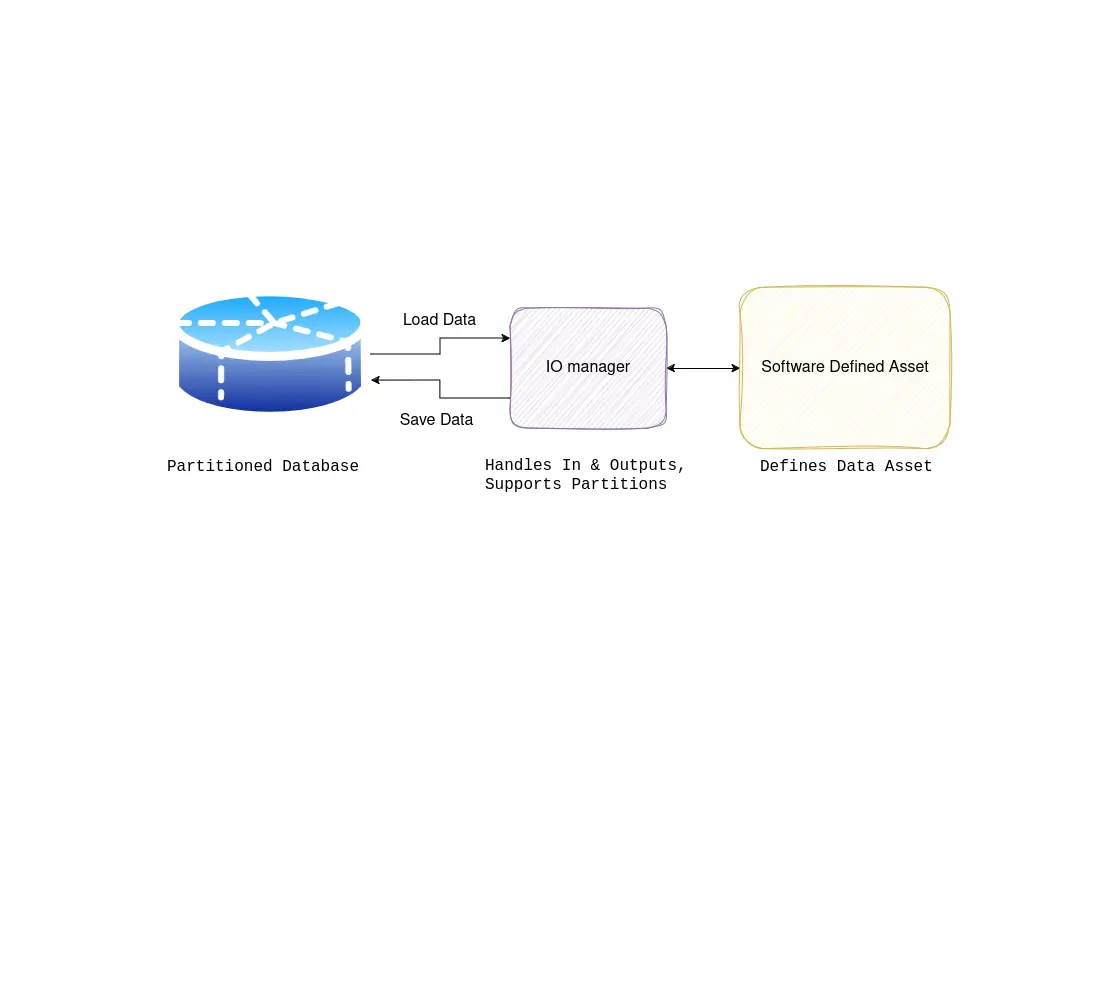
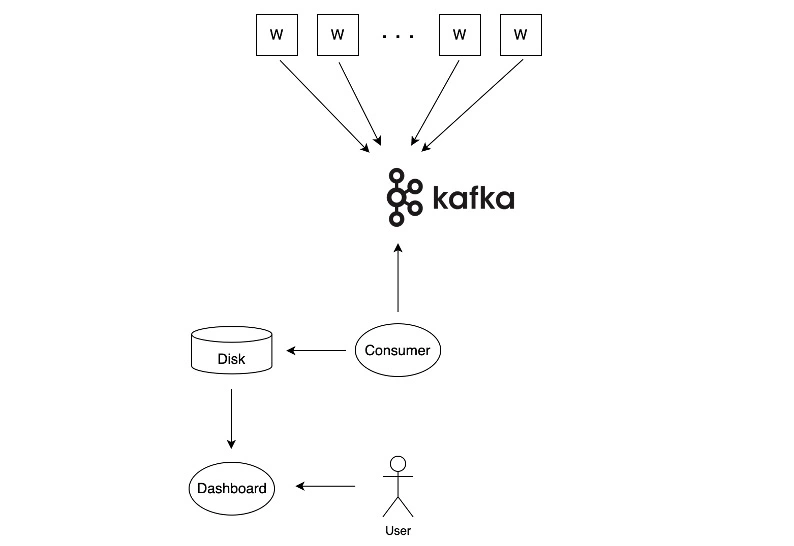 Figure 4: A schematic of a system where workers (w) send events to Apache Kafka, while a consumer transforms and save data to make it available for users.
The job of the consumer is to process all events by updating the relevant statistics, and saving these statistics to disk. When it encounters an event signalling that a job has ended, for example:
|
|
the consumer can keep track of the average runtime by keeping track of the total amount of jobs it processed and the total runtime of these jobs.
Averages can be calculated from the total runtime and total amount of jobs
and anomalies - the longest jobs for instance - can be tracked separately.
The same holds for (average) queueing time and the number of jobs in the queue.
In this example, we add 10 seconds to the total queueing time and 20 seconds to the total runtime.
And it is probably wise to aggregate this per job_type.
In Python, a basic implementation of a self-updating data class would be:
|
|
As can be seen, it is easy to extract the relevant metrics. Of course, this gets more complicated when you introduce aggregations and keeping track of anomalies. Making separate aggregation classes that can handle logs independently keeps responsibilities nicely separated in this case (also see the observer pattern).
For the collection of traces, we need to keep track of how many jobs have not ended yet for a single trace_id.
This can be done by tracking the amount of dispatch-logs versus the amount of end-logs,
assuming that we receive all dispatch-logs of child-jobs before receiving an end-log of a job.
The metrics can be saved to disk frequently to provide a live view to the user from a dashboard.
Although these events are fairly simple, they can provide a significant amount of value when used properly. Using the regular statistics in together with the parent-child relationship, we can start showing the user:
Knowing these three properties for all jobs allows us to optimize appropriately and respond to queues piling up. Moreover, since these numbers are provided real-time, it is possible to build an alerting system into the pipeline: the relevant people could be notified that something is wrong, and act accordingly.
We will soon add a post about a specific implementation of a dispatcher that sends out the three events in Laravel. This will show what implementation details to keep in mind when adding such functionality to your application. Stay tuned!

Donny is wiskundige en begon als software- en data-engineer te freelancen voordat hij BiteStreams begon. Hij is goed in het ontwerpen van systemen die aan (complexe) behoeftes van de klant voldoen. In zijn vrije tijd sport en leest hij en gaat hij graag een drankje doen met vrienden.
Meer lezenEnjoyed reading this post? Check out our other articles.
Maximilian Filtenborg
 Maximilian Filtenborg
 Maximilian Filtenborg
Wordt meer datagedreven met BiteStreams en laat de concurrentie achter je.
Contacteer ons